
This work was part of the Data Visualisation Challenge hosted by 360Giving https://challenge.threesixtygiving.org/. It looks to answer the following question posed by a panel of experts in the grantmaking sector: Who funds what themes throughout the years ?
A snapshot of the visualisation is shown below. The link to the Interactive Tableau visualisation dashboard can be found found here
DATA COLLECTION AND CLEANING
The data was acquired from the Grant Nav database filtered from years 2008-2017. The data was subsequently cleaned using a custom script in R programming language to remove unnecessary columns (like additional redundant location info) and adapting formats of date and location information e.g. removing ‘North East’ in ‘North East Lincolnshire’ or removing other stopwords like ‘City of’ , ‘City’, ‘County’ in the location name to make it easier to filter and plot on a map. More information can be found in the source code (https://github.com/ryankarlos/GrantNav_Challenge1). The data was then filtered into themes according to keywords (note that initially a range of themes were tested to see how much data was included in each – only three of these were chosen below): a) ‘elderly’, ‘older people’, ‘dementia’ would suggest the theme is elderly b) projects with ‘sports’, ‘fitness’ for sports theme c) projects with ‘science’ for science theme Another column was added to identify if the location was based in London or not (yes or no). This would be used for filtering a London only map in the visualisation. The major challenge was to manually fill in location data for recipient organisations which did not have any location info on Grant Nav (a large proportion of these were universities). For this, a combination of websites were used to check the organisation locations like Find that Charity [1], Charity Base [2] and the Charity Commission [3].
VISUALISATION
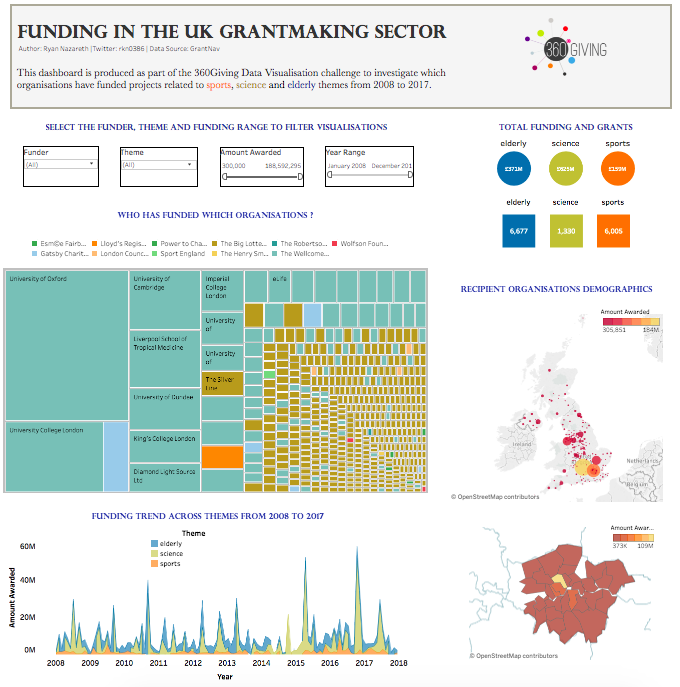
The interactive dashboard created in Tableau allows the user to filter the year, funding organisation and amount funded. By default the minimum grant award has been set as £300,000 as it allows easier inspection of the visualisations but this can be adapted by changing the lower range number in the select box. The treemap on the left shows the recipient organisations receiving the most funding based on the size of the squares and the colour corresponds to the funder. The spatial map of UK on the right shows the locations of the recipient organisations and amount funded (encoded by size and colour of the circles) across the UK. Note that the data also included recipients in locations outside (and close to) the UK such as Ireland but these are not reflected in the map as it was tricky integrating foreign locations along with the UK geocoding in Tableau. Since the location info in London is quite clustered to visualise in the UK map alone, I thought it would be useful to include a map of London boroughs to allow visualisation of where the recipients are located within London (here the amount of funding is colour coded – lighter the colour, the more the funding). The stacked line chart on the bottom left shows how the trend in funding varies across the time period for the different themes. The width of each of the theme colours at any point is the funding received for that point in time. Each of the charts can be hovered over to get more information about funders and recipient organisations etc. Additionally, selecting a section of each chart filters the entire dashboard e.g. a square on the treemap corresponding to a single recipient, a single theme (colour) on the stacked line chart etc.
RESULTS
The results show that the elderly and sports themed projects receive the most grants (over 6000) whilst the sports themed projects received the most funding of around £625M (with less than a third of as many grants as the other two themes). The Big Lottery Fund and Wellcome Trust account for majority of the funding across all themes as seen in the treemap, with the Gatsby Charitable foundation and Lloyds Register Foundation also making large donations above £3M. It’s interesting to note that the Big Lottery fund contribute more smaller grants (large number of smaller brown squares), whilst the Wellcome Trust contribute relatively fewer grants but the value of each of the grants is much larger (larger blue squares). Science Theme The top recipients seem to be around the London, Oxford and Cambridge region which is home to a number of these universities like UCL, Kings College London, Imperial College London, London School of Tropical Medicine and Hygiene, University of Oxford, University of Cambridge. Up north, Liverpool gets the most funding (home to the Liverpool School of Tropical Medicine) followed by Manchester, parts of Yorkshire(Sheffield, York, Leeds) and Newcastle. Unsuprisingly, the Wellcome Trust which is a major research charity funds most of these university and research institute projects. £625M went into funding science research during this period. The line chart shows prominent peaks around April 2015 (£47.7M), October 2016 (£51.1M), Sep 2010 (£32.6M), April 2013 (£26M). We can see peaks at regular intervals with periods of little funding in between – which reflects the fixed term nature and specific timing of commencement of research projects. Elderly Theme Here we find the demographics a lot more clustered than the science theme with the Midlands, North West, South West and Northern Ireland regions receiving the most grants. Within London, Camden, Westminster, Islington and Kensington boroughs received the most funding. Around £371M went into elderly themed projects during this period with a total of over 6600 grants funded. Again Welcome Trust contributed a larger chunk of the donations (mainly between £2M to £15M) during this period predominantly to universities. The Big Lotter Fund contributed a large number of smaller donations (between £300000 to £2M) to old age related charitable organisations with notable donations between £4M - £10M to Alzheimer’s society, Social Finance Limited and The Silver Line Helpline. The line chart shows prominent peaks around March 2011 (> £15M), April 2012 (£14.5M) and August 2013 (£12.3M). It seems the period between 2011 and 2014 was particularly strong in terms of funding (compared to 2008 – 2011) followed by a dip between September 2014 and March 2015. Funding in this theme is more distributed over time compared to the science theme which has peaks at intervals. Sports Theme £159M worth grants were funded during the period between 2008 to 2017, with the top contributors Wellcome Trust and the Big Lottery Fund funding mainly universities and charities/communities respectively. Sport England funded a project worth over £1.1M at the Redbridge Sports Centre and the Power to Change made smaller contributions just over £300000 to a Community Trust and Association. The demographics are more clustered around the Midlands, North West, Yorshire region, Cambridge and South East. Liverpool, Birmingham, Cambridge and Leeds received the most funding (over £3M). Within London, the funding was more distributed across the central part (compared to the other themes) with Camden, Tower Hamlets and Southwark boroughs receiving the most funding (over £1.7M each), and other recipients in South (Bromley, Croydon) and East London (Barking) also benefiting from grants The line chart shows a strong period of funding between Jan 2009 to October 2009 and Nov 2015 – July 2016 with over £3M worth grants being funded during this period.
LICENSING
As required as part of this challenge, this work is licensed under a Creative Commons Attribution 4.0 International License (included in the footer of the dashboard).
RESOURCES
- Find that charity http://apps.charitycommission.gov.uk/showcharity/registerofcharities/RegisterHomePage.aspx
- Charity Base https://charitybase.uk/
- Charity Commission Register of Charities http://apps.charitycommission.gov.uk/showcharity/registerofcharities/RegisterHomePage.aspx
Comments powered by Disqus.