
In the demo, we will analyse UK Crime Data with Pandas and GeoPandas. We will first collect latest crime data from Police API., We will then look at the properties of geospatial data and explore the different commands using geopandas to generate some pretty maps. We will also have a look at Uber’s open source package, KeplerGL to generate interactive maps
All the modules and functions used in this demo can be found in github The dependencies for this demo can be found in the pipfile with instructions on how to install them here
First we will load the london shape files and switching to EPSG coordinate system (lat/lon). The data is stored in the folder and can also be publically accessed from London Datastore
1
2
3
4
5
6
7
8
9
10
11
12
13
14
15
16
17
18
19
20
21
22
import geopandas as gpd

london_map = gpd.read_file('../data/ESRI/London_Borough_Excluding_MHW.shp')
london_map = london_map.to_crs(epsg=4326)
 # for mercator projection we could use epsg=3395
# for this map
london_map.crs

'''
<Geographic 2D CRS: EPSG:4326>
Name: WGS 84
Axis Info [ellipsoidal]:
- Lat[north]: Geodetic latitude (degree)
- Lon[east]: Geodetic longitude (degree)
Area of Use:
- name: World.
- bounds: (-180.0, -90.0, 180.0, 90.0)
Datum: World Geodetic System 1984
- Ellipsoid: WGS 84
- Prime Meridian: Greenwich
'''
We will just Keep the columns corresponding to the borough name, code and geometry (polygon)
1
2
london_map = london_map.loc[:, ['NAME', 'GSS_CODE', 'geometry']]
london_map.head(10)
| NAME | GSS_CODE | geometry | |
|---|---|---|---|
| 0 | Kingston upon Thames | E09000021 | POLYGON ((-0.33068 51.32901, -0.33059 51.32909… |
| 1 | Croydon | E09000008 | POLYGON ((-0.06402 51.31864, -0.06408 51.31861… |
| 2 | Bromley | E09000006 | POLYGON ((0.01213 51.29960, 0.01196 51.29980, … |
| 3 | Hounslow | E09000018 | POLYGON ((-0.24456 51.48870, -0.24468 51.48868… |
| 4 | Ealing | E09000009 | POLYGON ((-0.41183 51.53408, -0.41188 51.53412… |
| 5 | Havering | E09000016 | POLYGON ((0.15869 51.51219, 0.15871 51.51224, … |
| 6 | Hillingdon | E09000017 | POLYGON ((-0.40407 51.61318, -0.40388 51.61229… |
| 7 | Harrow | E09000015 | POLYGON ((-0.40407 51.61318, -0.40320 51.61318… |
| 8 | Brent | E09000005 | POLYGON ((-0.19657 51.52765, -0.19685 51.52773… |
| 9 | Barnet | E09000003 | POLYGON ((-0.19990 51.67017, -0.19970 51.66986… |
Now we will need to fetch recent crime data from Police API, which provides a rich data source of information on Data is available on police forces, crimes, policing areas and stop-and-search.
The code block below we first configure logging to stdout with formatting. The helper functions get_request and get_police_id returns police id associated with the requried force name, after making a get request to the api root. We request a police id for the Metropolitan Police Service as we are interested in crime data associated with London.
1
2
3
4
5
6
7
8
9
10
11
12
13
14
15
16
17
18
19
20
21
22
23
24
25
26
27
28
29
30
31
32
33
34
35
36
37
38
39
40
41
42
43
44
45
46
47
48
49
50
51
52
53
54
55
56
57
58
import requests
import logging
import os
from requests.exceptions import HTTPError, ConnectionError

# this will remove the root logger and avoid duplicate logs in notebook
for handler in logging.getLogger().handlers:
    logging.getLogger().removeHandler(handler)

logger = logging.getLogger()
handle = logging.StreamHandler()
formatter = logging.Formatter("%(asctime)s - %(name)s - %(levelname)s - %(message)s")
handle.setFormatter(formatter)
logger.addHandler(handle)
logger.setLevel(logging.INFO)

URL_BASE="https://data.police.uk/api/"


def get_request(url):
    response=requests.get(url, timeout=30)
    try:
    # If the response was successful, no Exception will be raised
        response.raise_for_status()
    except HTTPError as http_err:
        logger.exception(f'HTTP error occurred: {http_err}')
    except Exception as err:
        pass
        logger.exception(f'Other error occurred: {err}')
    else:
        logger.info(f'HTTP request for {url} was successful!')

    response.encoding = 'utf-8'

    return response.json()

def get_police_id(get_request, force_name):
    """
    Get police id and police force names in json
    """
    url = os.path.join(URL_BASE, "forces")
    response = get_request(url)
    for json in response:
        if json.get('name') == force_name:
            police_id = json.get('id')
            break

    print(f"Police id for {force_name}:- '{police_id}'")

    return police_id


force_name='Metropolitan Police Service'
police_id = get_police_id(get_request, force_name)


#2021-05-16 02:37:46,229 - root - INFO - HTTP request for https://data.police.uk/api/forces was successful!
#2021-05-16 02:37:46,230 - root - INFO - Police id for Metropolitan Police Service:- 'metropolitan'
Now we can retrieve stop and search data for a given police force using the helper functions created in the code block below. Then function removes any data with no location info By default, if we do not pass a specific date, then we will get all stop and search data which have lead to outcomes like arrest, court summons for the latest month(s). However we will only fetch data for the month of Jan 2021. In this case, we get 5338 street search arrests.
1
2
3
4
5
6
7
8
9
10
11
12
13
14
15
16
17
18
19
20
21
22
23
24
25

def get_neighbourhoods(get_request, police_id):

    url = os.path.join(URL_BASE, f"{police_id}/neighbourhoods")

    return get_request(url)

def get_stop_search_by_force(get_request, police_id, date=None):

    ignored_outcomes = ['A no further action disposal', False, '']
    new_list = []
    if date is None:
        url = os.path.join(URL_BASE, f"stops-force?force={police_id}")
    else:
        url = os.path.join(URL_BASE, f"stops-force?force={police_id}&date={date}")
    response = get_request(url)
    for json in response:
        if (json.get('outcome') not in ignored_outcomes) and (json.get('location') is not None):
            new_list.append(json)

    logger.info(f"Successfully fetched data from month: {date}")
    return new_list

neighbourhoods = get_neighbourhoods(get_request, police_id)
crime_london_json = get_stop_search_by_force(get_request, police_id, date='2021-01')
We will now convert the json to Geopandas dataframe with selected columns after reassinging types.
1
2
3
4
5
6
7
8
9
10
11
12
13

import pandas as pd
import numpy as np

data = pd.DataFrame(crime_london_json)
data['latitude'] = data['location'].map(lambda x: np.float(x['latitude']))
data['longitude'] = data['location'].map(lambda x: np.float(x['longitude']))
data['datetime'] = data['datetime'].astype('datetime64[ns]')
data['gender'] = data['gender'].astype ('category')
data['outcome'] = data['outcome'].astype ('category')
data = data[['datetime', 'latitude', 'longitude','outcome', 'gender', 'object_of_search']]

geo_ds = gpd.GeoDataFrame(data, geometry=gpd.points_from_xy(data.longitude, data.latitude))
| datetime | latitude | longitude | outcome | gender | object_of_search | geometry | |
|---|---|---|---|---|---|---|---|
| 0 | 2021-01-07 23:20:00 | 51.472815 | -0.452212 | Arrest | Male | Controlled drugs | POINT (-0.45221 51.47281) |
| 1 | 2021-01-14 11:20:00 | 51.475074 | -0.493087 | Penalty Notice for Disorder | Male | Stolen goods | POINT (-0.49309 51.47507) |
| 2 | 2021-01-15 17:30:00 | 51.459780 | -0.447730 | Community resolution | Male | Controlled drugs | POINT (-0.44773 51.45978) |
| 3 | 2021-01-19 12:35:00 | 51.469708 | -0.451842 | Penalty Notice for Disorder | Male | Controlled drugs | POINT (-0.45184 51.46971) |
| 4 | 2021-01-24 21:40:00 | 51.466996 | -0.420462 | Arrest | Male | Offensive weapons | POINT (-0.42046 51.46700) |
We can now read in the london basemap and overlay all the crime events on it.
1
2
3
4

london_map = gpd.read_file('../data/london_basemap.geojson')
ax = london_map.plot(figsize=(10, 10), alpha=0.5, color="wheat", edgecolor="black")
new_ax = geo_ds.plot(ax=ax, marker="o", color="red", markersize=5)

We can also create a new dataframe with the number of crimes by borough
1
2
3
4
5
6
7
8
9
10
11
merged_df = gpd.sjoin(london_map, geo_ds, how="inner", op='intersects')
merged_df['outcome'] = merged_df['outcome'].cat.rename_categories({'Caution (simple or conditional)':'Caution',
                                                              'Khat or Cannabis warning':'Drugs warning',
                                                              'Penalty Notice for Disorder':'Penalty Notice for Disorder',
                                                              'Summons / charged by post': 'Summons'})

total_crimes_borough = merged_df.groupby(['NAME'])['outcome'].count().reset_index()

df_chloro = merged_df[['NAME', 'geometry']].merge(total_crimes_borough, how='inner', on='NAME').rename({'outcome':'crimes'}, axis='columns')
df_chloro = df_chloro.drop_duplicates().reset_index(drop=True)
df_chloro.head()
| NAME | geometry | crimes | |
|---|---|---|---|
| 0 | Kingston upon Thames | POLYGON ((-0.33068 51.32901, -0.33059 51.32909… | 68 |
| 1 | Croydon | POLYGON ((-0.06402 51.31864, -0.06408 51.31861… | 223 |
| 2 | Bromley | POLYGON ((0.01213 51.29960, 0.01196 51.29980, … | 139 |
| 3 | Hounslow | POLYGON ((-0.24456 51.48870, -0.24468 51.48868… | 137 |
| 4 | Ealing | POLYGON ((-0.41183 51.53408, -0.41188 51.53412… | 198 |
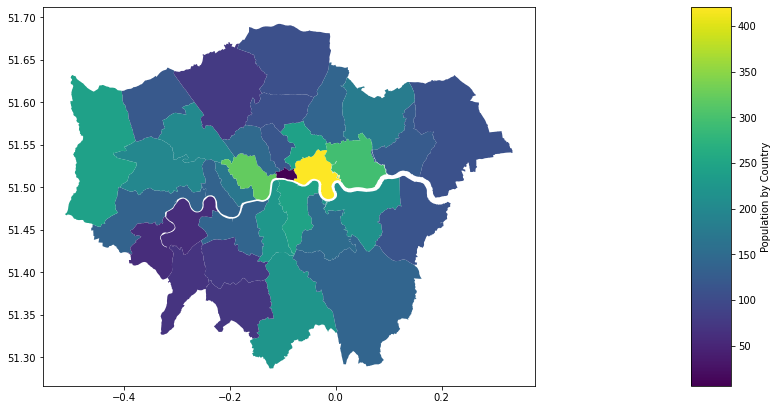
We can create a cholorpeth map so we can visualise number the aggregated dataframe above.
1
2
3
4
5
6
7
8
9
10
from mpl_toolkits.axes_grid1 import make_axes_locatable
import mapclassify
import matplotlib.pyplot as plt
scheme = mapclassify.Quantiles(df_chloro['crimes'], k=100)
fig = plt.figure(figsize=(15,15))
ax = fig.add_subplot(111)
divider = make_axes_locatable(ax)
cax = divider.append_axes("right", size="5%", pad=0.1)
df_chloro.plot(column='crimes',ax=ax,legend=True,legend_kwds={"label": "Population by Country"},cax=cax)
Kepler.gl is a web-based visualisation tool built on top of deck.gl for large Geospatial datasets which was open sourced by Uber in 2018. It can also be used in jupyter notebook to generate interactive maps.
We can just import KeplerGl class from keplergl package and load the keplergl map object. If running in jupyter notebook, the kepler.gl widget will be loaded below the cell. This will be an empty map.
1
2
3
from keplergl import KeplerGl

m = KeplerGl(height=1000)
We can then add the shapefile and crime data, created previously by calling the add_data method multiple times with the data passed in as parameter. The data can be csv, geojson, pandas dataframe or geopandas geoDataframe format.
1
2
3
geo_ds = geo_ds.drop('datetime', axis=1)
m.add_data(data=london_map, name='london sf')
m.add_data(data=geo_ds, name='crime')
We can then save the map as html for viewing.
1
2
3

m.save_to_html(file_name='crime_kepler.html')
The map can also be served by a flask app using the snippet below. The function index() needs to return the html representation of kepler map object.
1
2
3
4
5
6
7
8
9
10
from flask import Flask

app = Flask(__name__)

@app.route('/')
def index():
    return m._repr_html_()

if __name__ == '__main__':
    app.run(debug=True)
Comments powered by Disqus.